VALIDATION USING DATA FROM AWS
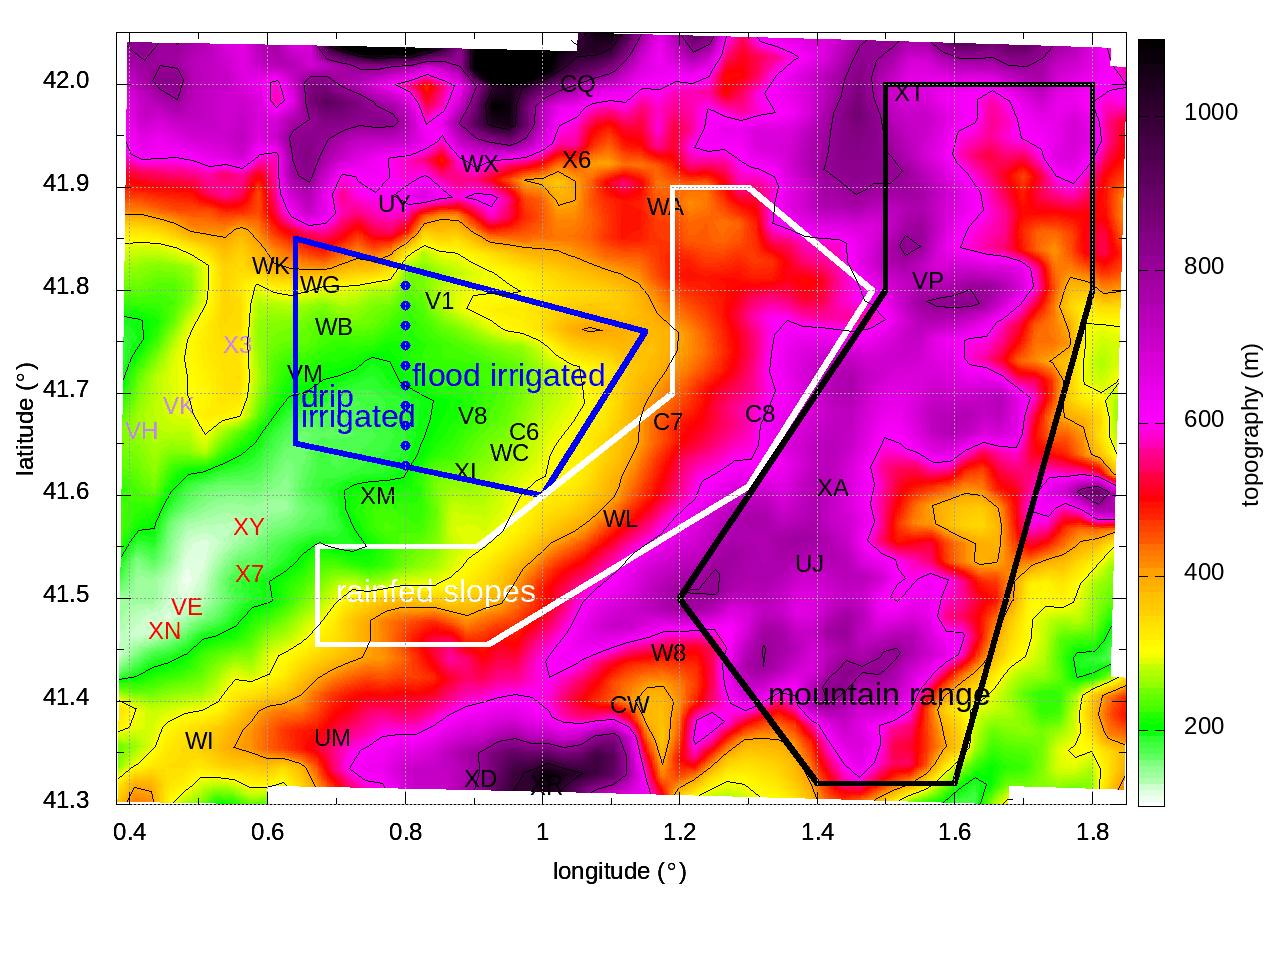
The location of the chosen points to validate the model outputs is plot in the following map.
 In the following plots, the above selected points are shown as:
* West AWS (in purple in the map): Gimenells (VH), Raimat (VK), Alguaire (X3)
* South AWS (in red in the map):Seròs (XN), Aitona (VE), Torres de Segre (X7), Alcarràs (XY)
* Drip irrigated AWS (those included in the blue polygon): Vilanova de Segrià (VM), Algerri (WG), Albesa (WB)
* Flood irrigated AWS (those included in the blue polygon): Mollerussa (XI), Vallfogona de Balaguer (V1), Golmés (WC), Castellnou de Seana (C6), el Poal (V8)
* Rainfed slopes (those included in the white polygon): Tàrrega (C7), Sant Martí de Riucorb (WL), Cervera (C8), Oliola (WA)
* Mountain range (those included in the black polygon):la Panadella (XA), Solsona (XT)
BIAS, RMSE and correlation coefficient are computed to check how reallistic are the simulations. They are computed over the whole period and during day (1000- 1400 UTC), night (0000 - 0400 UTC) and afternoon (1400 - 2000 UTC).
Wind speed: BIAS, RMSE, correlation coefficient
Wind direction: BIAS, RMSE, correlation coefficient
temperature: BIAS, RMSE, correlation coefficient
specific humidity: BIAS, RMSE, correlation coefficient
Summary of the plots (averages over different regions)
Summary of the plots (averaged over all regions)